In Riverside, the alluvial fans from the San Bernardino Mountains create abrupt lateral changes in soil type — sand, gravel, and clay lenses can shift within meters. A single borehole often misses these transitions. Electrical resistivity / VES fills that gap by mapping resistivity contrasts across a profile. The method injects current into the ground through two electrodes and measures the potential difference at two receiver electrodes. From the apparent resistivity curve we invert a 1D or 2D model of the subsurface. Before mobilizing a drill rig, we run resistivity lines to target the most representative boring locations. The technique is especially useful when combined with a georradar GPR survey to correlate shallow anomalies with deeper resistivity layers.
A 48-electrode resistivity line in Riverside can detect a 2-meter thick clay lens under dry sand at 15-meter depth — a feature a single borehole would miss entirely.
Method and coverage
The equipment we deploy in Riverside is a 48-electrode multichannel system with a 5-meter electrode spacing, giving a depth of investigation around 40 meters. The array used is Schlumberger for VES soundings and Wenner-Schlumberger for 2D profiles. Each line takes about 45 minutes to acquire, including topography correction with a GPS rover. The cables are heavy-duty, rated for the summer heat in the inland valley. Data processing is done in Res2DInv and EarthImager; we apply a solid inversion to handle the high-resistivity contrast between dry alluvium and the saturated zone. For shallow foundations, we cross-check VES results with placa de carga tests to calibrate the interpreted resistivity values against actual bearing capacity.
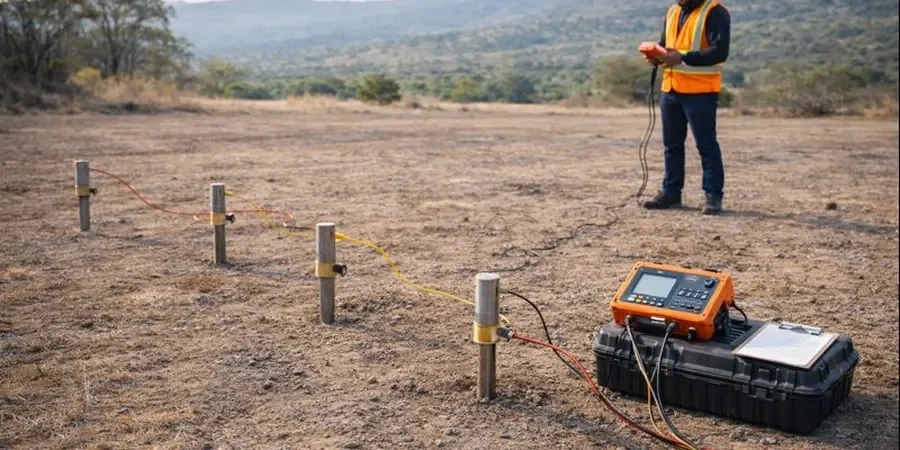
Technical reference image — Riverside
Regional considerations
ASCE 7-22 requires site-specific seismic hazard analysis for structures in Soil Class D or lower. In Riverside, the groundwater table can rise seasonally from 30 m to 10 m depth after wet winters, saturating loose sands that may liquefy. Electrical resistivity / VES identifies the depth to the water table and the extent of low-resistivity clay layers that could amplify ground motion. Without this data, a foundation designed with an assumed uniform profile may experience differential settlement during a seismic event. The method also detects voids from abandoned gravel mining pits in the Santa Ana River floodplain — a hazard not visible from surface inspection.
Continuous profile across a site to map lateral and vertical changes. Ideal for detecting paleochannels, clay lenses, and the top of bedrock in Riverside's alluvial fan deposits.
02
Vertical Electrical Sounding (VES)
Point-specific 1D depth sounding with expanding electrode spacing. Used for groundwater depth estimation, aquifer delineation, and soil layering where only a single profile is needed.
03
3D Resistivity Tomography
Multiple parallel 2D lines inverted together to create a volumetric model. Applied to complex sites like the Box Springs area where fault-related heterogeneity requires full spatial coverage.
Standards that apply
ASTM D6431-18 (Standard Guide for Using Direct Current Resistivity), ASCE 7-22 (Minimum Design Loads, Site Classification), IBC 2021 (Chapter 18, Soils and Foundations)
Q&A
What is the difference between 2D ERT and VES?
VES measures resistivity at a single point with increasing depth, giving a 1D layer model. ERT uses multiple electrodes along a line to produce a 2D cross-section showing lateral as well as vertical changes. For Riverside's variable alluvium, ERT is usually preferred because it captures the rapid horizontal transitions between sand and clay lenses.
How deep can the resistivity survey reach in Riverside soils?
With a 10-meter electrode spacing, the maximum investigation depth is about 40 to 60 meters, limited by current penetration through dry alluvium. In saturated conditions, the depth is slightly less because the current flows preferentially through the conductive groundwater. We adjust the array length on site based on target depth requirements.
Can electrical resistivity detect groundwater in Riverside?
Yes. Groundwater appears as a sharp drop in resistivity, typically from 500–1000 ohm-m in dry alluvium to 20–80 ohm-m in saturated sand. The method is routinely used in Riverside to map the water table depth before installing monitoring wells or designing dewatering systems for excavations.
How much does a resistivity survey cost in Riverside?
A typical VES sounding starts around US$540, while a full 2D line of 48 electrodes with inversion and reporting ranges from US$800 to US$1.200. The final cost depends on the number of lines, site accessibility, and whether additional borehole calibration is required.