A common mistake we see in Riverside is relying solely on point-based borings for site characterization. The geology here is complex—alluvial fans, ancient river channels, and variable fill layers—meaning a few SPT holes can miss critical velocity contrasts. Seismic tomography fills that gap by imaging the subsurface as a continuous 2D or 3D profile. It reveals the P-wave and S-wave velocity structure, directly informing site class per ASCE 7 and helping designers avoid surprise stiffness changes that affect foundation performance. Without it, you risk designing for a soil profile that doesn't exist across the whole site.
Seismic tomography in Riverside reveals buried channels and velocity inversions that standard borings routinely miss, directly affecting site class and foundation design.
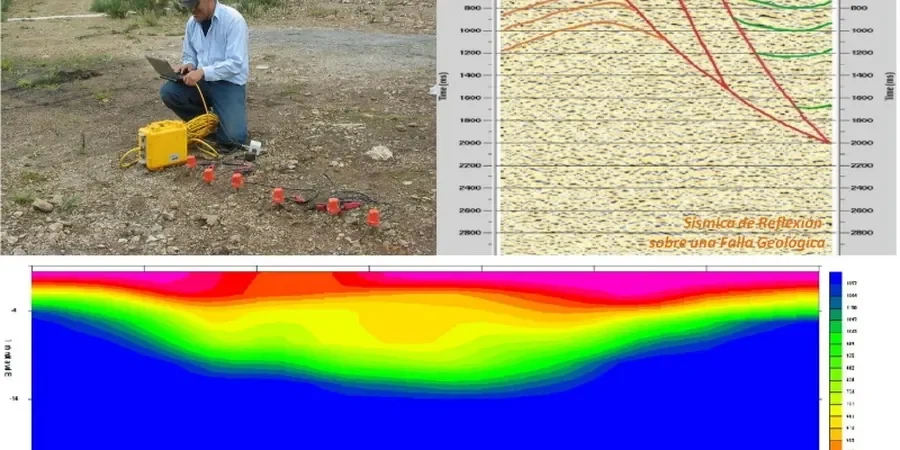
Method and coverage
Take a 10-story residential project on Riverside's east side, near the Santa Ana River. The geologist suspected loose sands over stiff older alluvium, but the velocity model from seismic tomography showed a buried paleochannel filled with soft clay and organic material. That anomaly would have been missed by standard borings spaced 30 meters apart. We deploy 24- to 48-channel geophone spreads with sledgehammer or accelerated weight-drop sources. For deeper targets, we use explosive charges (per local safety codes). The output is a velocity tomogram with resolution down to 0.5 m in the upper 15 m, and deeper coverage to 50 m. This data links directly to site response analysis for seismic design and to liquefaction assessment in Riverside's alluvial zones. We also cross-reference with MASW-Vs30 surveys for shear-wave velocity profiles.
Technical reference image — Riverside
Regional considerations
In Riverside, many engineering teams still treat the subsurface as horizontally layered. The reality is different: old stream channels, debris flow deposits, and buried utility backfills create lateral velocity variations of 30-50% over a few meters. Seismic tomography catches these contrasts. When we survey near the I-215 corridor, we regularly see low-velocity zones that correspond to undocumented fill from the 1950s. Ignoring those zones can lead to differential settlement or underestimating seismic site amplification. The technique is non-invasive and can be deployed on active construction sites, parking lots, or along existing roads without disruption.
24 to 48 channels (standard); up to 96 for high-res
Source type
Sledgehammer (8-16 lb), accelerated weight-drop, or miniblast
Depth of investigation
5 to 50 m (variable by spread length and source energy)
Resolution (upper 15 m)
0.5 to 1.0 m cell size in tomogram
Velocity output
P-wave (Vp) and S-wave (Vs) profiles; Poisson ratio derived
Site class per ASCE 7
Mapped directly from Vs30 to Class B, C, D, or E
Complementary services
01
Seismic Refraction Tomography (SRT)
First-arrival travel-time inversion for P-wave velocity models. Ideal for bedrock depth mapping, rippability assessment, and detecting velocity inversions in alluvial fill. Typical spreads: 24 geophones at 2-5 m spacing, 12-24 shot points.
02
Seismic Reflection Tomography (SRT-R)
Reflection processing (CMP stacking, migration) for high-resolution imaging of stratigraphic boundaries, fault zones, and buried channels. Used where vertical resolution below 1 m is needed, especially in Riverside's near-surface fluvial deposits.
Standards that apply
ASTM D5777-20 (Standard Guide for Using the Seismic Refraction Method for Subsurface Investigation), ASTM D7128-18 (Standard Guide for Using the Seismic Reflection Method for Shallow Subsurface Investigation), ASCE 7-22 (Minimum Design Loads and Associated Criteria for Buildings and Other Structures — Site Class Determination)
Q&A
How deep can seismic tomography image in Riverside's alluvial soils?
Typical surveys reach 15-30 m with a sledgehammer source and up to 50 m with an accelerated weight-drop or small explosive charge. Depth depends on spread length, source energy, and ambient noise levels. Near the Santa Ana River, we often achieve 25-35 m penetration in saturated sands.
What is the difference between refraction and reflection tomography?
Refraction tomography uses first-arrival travel times to invert for velocity structure, best for detecting velocity contrasts and bedrock depth. Reflection tomography processes reflected wave arrivals (CMP method) to image stratigraphic boundaries and fault zones with higher vertical resolution. We recommend both when fine layering or structural detail is critical.
What is the typical cost range for a seismic tomography survey in Riverside?
For a standard 24-channel survey covering 100-200 linear meters, the cost ranges between US$2,610 and US$5,410. Larger spreads, multiple profiles, or reflection processing increase the scope. Contact us for a site-specific quote based on your project requirements.
How does seismic tomography data feed into ASCE 7 site class classification?
The Vs30 value (average shear-wave velocity in the upper 30 meters) derived from tomography profiles directly determines Site Class A through F per ASCE 7-22. In Riverside, we commonly map Class C (360-760 m/s) and Class D (180-360 m/s) zones. The continuous velocity model also identifies anomalies that could trigger Site Class F if liquefaction or soft clay is present.