We were called to a site on Magnolia Avenue where the client planned to overlay a failed asphalt section on an old concrete base. That kind of composite pavement needs more than a visual check — we had to core through the asphalt, extract intact concrete samples, and run a FWD test to back-calculate the subgrade modulus. In Riverside, where the alluvial fan deposits from the San Bernardino Mountains create abrupt changes in soil stiffness from one street to the next, a single boring won't cut it. We always combine a georradar GPR survey to map hidden base layers with a series of dynamic cone penetrometer tests to capture the variability across the project footprint.
A single boring in Riverside's alluvial fan can miss the lateral variability that causes pavement failure just 50 feet away.
Method and coverage
Riverside sits in a semi-arid climate with annual rainfall under 10 inches, but when it rains it comes hard — the 2010 storm that dropped 3 inches in 24 hours flooded several arterial roads and exposed where base courses had lost their structural integrity due to capillary rise from a shallow water table. That's why our existing pavement evaluation here always includes a full suite of moisture-sensitive parameters: we measure the in-situ density with a nuclear gauge, run a CBR test on recompacted samples from the base course, and perform a swell test on the subgrade if the soil classifies as CL or CH under the USCS.
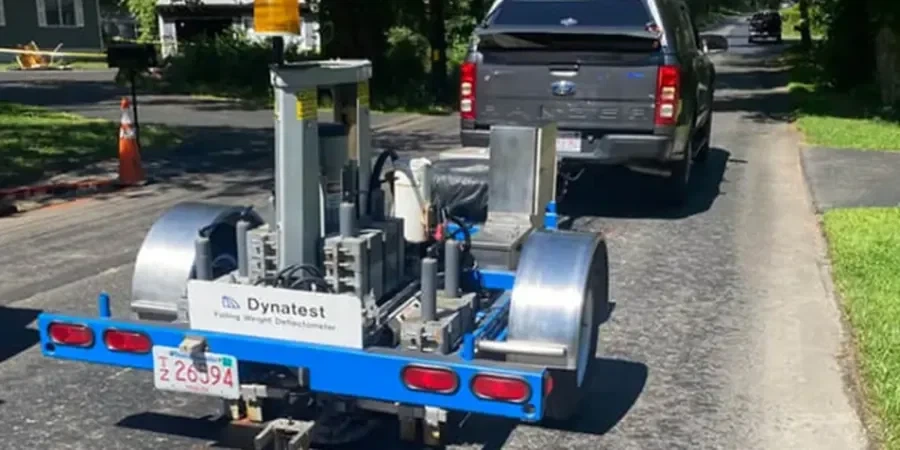
Falling Weight Deflectometer (FWD) for load-transfer efficiency on concrete joints
Core recovery and compressive strength testing on existing concrete slabs
Dynamic cone penetrometer (DCP) for subgrade strength profile
Technical reference image — Riverside
Regional considerations
The biggest risk we see in Riverside is assuming the existing base course behaves uniformly. We've run the FWD and found a subgrade modulus of 15,000 psi at one location and 4,000 psi just 80 feet away — same street, different construction history. That variability means the overlay design based on the average value will fail at the weak spot. We always recommend at least one DCP profile per 100 linear feet of pavement and a minimum of two cores per lane-mile to capture the real distribution of layer strengths.
4 in. (100 mm) for asphalt, 6 in. (150 mm) for concrete
Moisture content
ASTM D2216 — oven-dry method
Swell test
ASTM D4546 — 1% strain threshold
DCP index
mm/blow converted to CBR via Webster 1992
Complementary services
01
FWD structural analysis for overlay design
Using the AASHTO 1993 empirical-mechanistic method, we backcalculate the effective structural number of the existing pavement and recommend overlay thickness. We also identify debonded layers and base voids that conventional coring might miss.
02
Subgrade variability mapping with DCP
The dynamic cone penetrometer gives us a continuous strength profile at a fraction of the cost of multiple borings. In Riverside's variable alluvium, we combine DCP profiles with falling weight deflectometer data to produce a spatial map of CBR values every 50 feet.
Standards that apply
ASTM D4694 — FWD deflection testing, ASTM D1883 — CBR test for base and subgrade, ASTM D4318 — Atterberg limits for subgrade soil classification
Q&A
How many cores do you typically take per lane-mile of existing pavement?
We recommend a minimum of two cores per lane-mile for asphalt and three for concrete, but we increase the density to one core per 500 feet if the pavement shows significant cracking or if the subgrade soil changes visibly along the alignment.
What is the difference between FWD and DCP for existing pavement evaluation?
The FWD measures the structural response of the entire pavement system under a simulated wheel load, giving you the effective modulus of each layer. The DCP measures only the subgrade strength profile, but it does so continuously at a much lower cost. We use FWD for overlay design and DCP for subgrade variability mapping.
How much does an existing pavement evaluation in Riverside typically cost?
The cost ranges between US$1,260 and US$4,250 depending on the number of cores, the use of FWD versus DCP, and the total length of pavement evaluated. A basic FWD survey with five cores runs around US$1,500, while a full structural evaluation with variability mapping approaches the upper end of that range.