The Santa Ana River floodplain and the alluvial fans from the Box Springs Mountains define Riverside's subsurface with interbedded sands, silts, and gravels reaching depths over 100 meters. This layered profile, combined with the region's proximity to the San Jacinto and San Andreas fault zones, makes seismic microzonation a critical step for any mid-rise or critical infrastructure project. We map the amplification potential and liquefaction susceptibility using measured shear-wave velocity profiles and standard penetration test data, producing zone boundaries that directly inform the design spectrum per ASCE 7-16. Before finalizing foundation loads, we integrate the MASW Vs30 survey to confirm the site class and adjust the response spectrum accordingly.
A single Vs30 measurement can miss lateral variability. Microzonation maps from multiple transects reduce that uncertainty for Riverside projects.
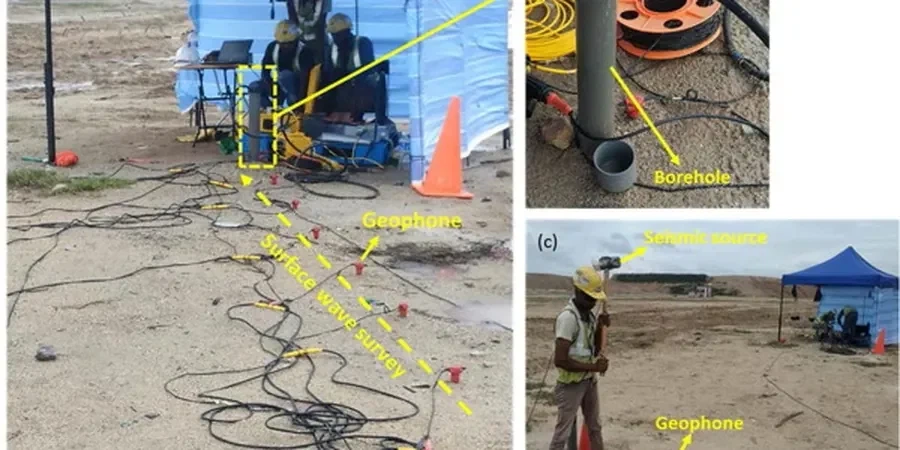
Method and coverage
Riverside's urban expansion since the 1950s pushed development onto older alluvial terraces with variable stiffness, where a single soil boring often misses lateral changes in density. Our seismic microzonation workflow combines geophysical arrays with borehole control to capture that variability. The process begins with a desk study of existing geologic maps and borehole logs, followed by a field campaign that includes:
Multichannel Analysis of Surface Waves (MASW) for Vs30 profiling along multiple transects;
Standard Penetration Tests with energy measurement at key boring locations;
Seismic refraction tomography to map the bedrock interface depth.
Each data set is correlated using the NEHRP site classification criteria and the NCEER liquefaction evaluation procedures. The final product is a color-coded microzonation map with recommended spectral accelerations for each zone, giving structural engineers a defensible basis for design.
Technical reference image — Riverside
Regional considerations
A four-story medical office building near the Riverside Community Hospital was designed using a generic Site Class D spectrum without microzonation. During peer review, our team ran a MASW profile that revealed Vs30 values of 320 m/s in the northern half and 410 m/s in the southern half of the same lot. The difference shifted the design spectrum for the northern portion, requiring additional shear walls and deeper footings. The owner avoided a costly retrofit after construction by investing in proper seismic microzonation during the design phase.
Multichannel surface wave acquisition along 4 to 8 transects per site, processed to produce 1D shear-wave velocity profiles and a 2D bedrock contour map. Data reduction follows ASTM D4428 with quality checks on dispersion curves.
02
Borehole SPT with Energy Calibration
Standard Penetration Tests at 1.5-meter intervals with automatic hammer energy measurement. N-values are corrected for overburden and rod length, then used to compute cyclic resistance ratio for liquefaction assessment.
03
Zonation Map & Design Parameters Report
A GIS-based map dividing the site into zones of uniform seismic response. Each zone includes recommended Fa, Fv, site-adjusted spectral accelerations, and a liquefaction potential index map. Deliverable includes a signed letter by the geotechnical engineer of record.
What is the difference between a site-specific response spectrum and seismic microzonation?
A site-specific response spectrum is calculated for a single point using one Vs30 value and soil column. Seismic microzonation divides the entire project area into zones, each with its own spectrum and liquefaction potential, capturing lateral variability that a single column misses. For large or irregular lots in Riverside, microzonation reduces the risk of under-designing one portion of the structure.
How much does a seismic microzonation study cost in Riverside?
For a typical 2- to 5-acre site in Riverside, the cost ranges between US$4,060 and US$17,930 depending on the number of MASW transects, borings, and laboratory tests required. The final price is determined after a scoping visit to confirm access and site conditions. Contact our office for a site-specific proposal.
Does Riverside require seismic microzonation for all new buildings?
The California Building Code (based on IBC 2021) mandates a site-specific ground motion hazard analysis for Risk Category IV structures and for sites with a known fault within 1 km. For other projects, microzonation is not legally required, but it is strongly recommended for any building with a footprint larger than 2,000 square meters or when variable soil conditions are suspected from preliminary borings.